Synthesis connected Pipeline
Overview
This pipeline represents the final architecture of the synthesis system, it contains multiple stages fron extraction, analyzing, and synthesizing the content of RL papers. The system combines OCR, computer vision (VLM ), natural language processing, and graph analysis to create comprehensive paper summaries and knowledge representations.

Pipeline architecture showing data flow from PDF upload to final visualization
Pipeline Components
OCR Processing (ocr.py)
The OCR module handles the initial document processing:
Converts PDF documents to images using pdf2image
Uses Tesseract OCR for text extraction
Implements layout analysis using LayoutParser with the PubLayNet model
Detects and extracts tables and figures from the document
Outputs: JSON file containing page text, table locations, and figure locations
- Configuration requirements:
Tesseract OCR installation
Poppler installation for PDF processing
PubLayNet model for layout detection
2. Vision Analysis (vision.py) The vision module analyzes extracted visual elements:
Uses NVIDIA AI models for image analysis
The model used is “microsoft/phi-3.5-vision-instruct”
Processes both tables and figures
Extracts context from surrounding text
Generates descriptions for visual elements
Outputs: Enhanced JSON with visual element descriptions
API Dependencies:
NVIDIA AI API access
Base URL: https://integrate.api.nvidia.com/v1
Content Processing (processor.py)
The processor module handles the semantic analysis:
Analyzes media items for relevance
Creates synthesis plans
Uses LLaMA model for content analysis
Determines essential visual elements
Outputs: Structured JSON with analysis results
Synthesis Generation (synthesis.py)
The synthesis module creates the final paper summary:
Generates section-by-section content Integrates visual elements Creates a cohesive narrative Outputs: Markdown file with complete synthesis
Knowledge Graph Analysis (knowledge_graph.py)
The knowledge graph module creates semantic representations:
Extracts key concepts and relationships
Creates graph visualizations
Uses NetworkX for graph processing
Outputs: JSON files with graph data and PNG visualization
Integration
Data Flow
PDF → OCR Results → Vision Analysis → Processing → Synthesis
Knowledge graph generation occurs in parallel after processing
File Formats
Input: PDF files
Intermediate: JSON files for data exchange
- Output:
Markdown synthesis
JSON knowledge graph data
PNG graph visualizations
Deployment
Dependencies
pip install -r r.txt
- Required external software:
Tesseract OCR
Poppler
Python 3.8+
API Configuration
Set the following environment variables:
NVIDIA_API_KEY
Other API keys as needed
Usage
Web Interface
Quick Analysis Interface (app.py)
streamlit run app.py
- This interface provides:
Summarized synthesis of the paper
Extraction of key entities and relationships
Interactive knowledge graph visualization
Entity and relationship downloads
Streamlined analysis process
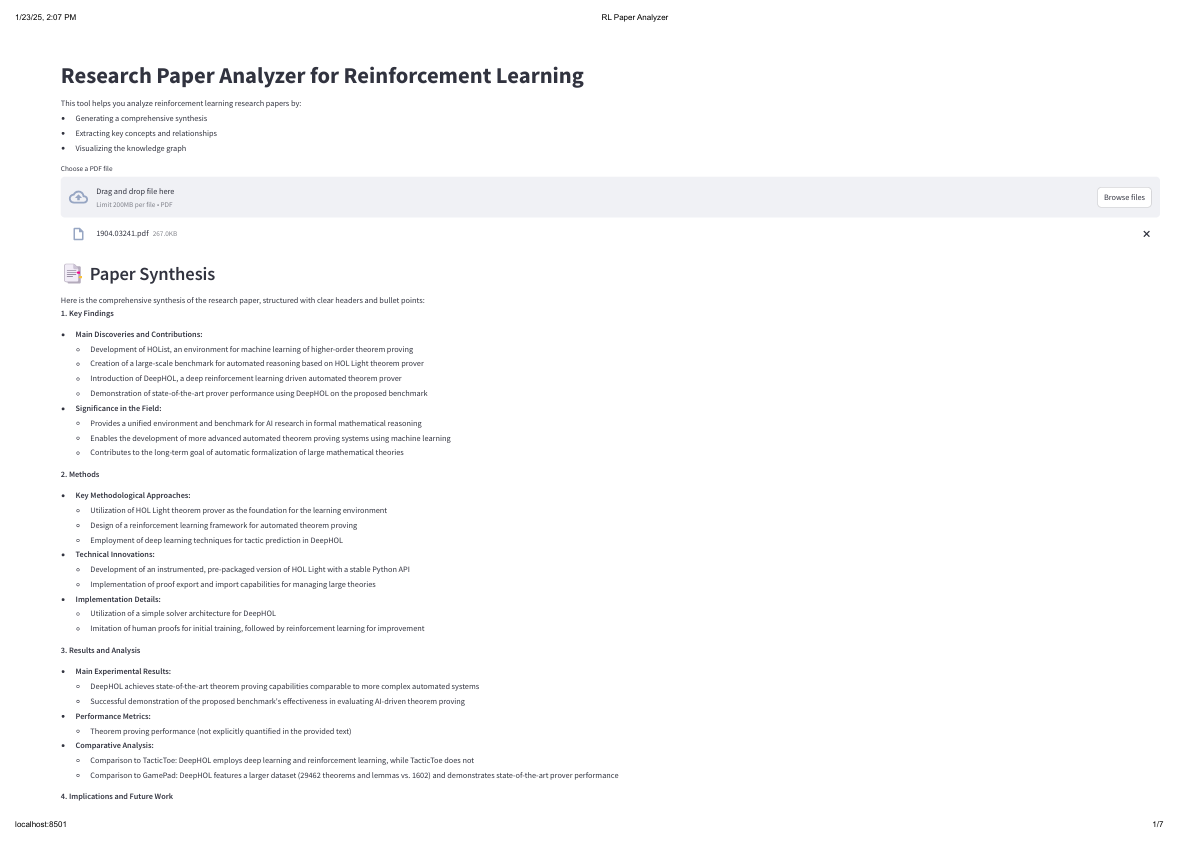
Initial upload and document synthesis of the quick analysis interface

Paper synthesis and entity extraction view
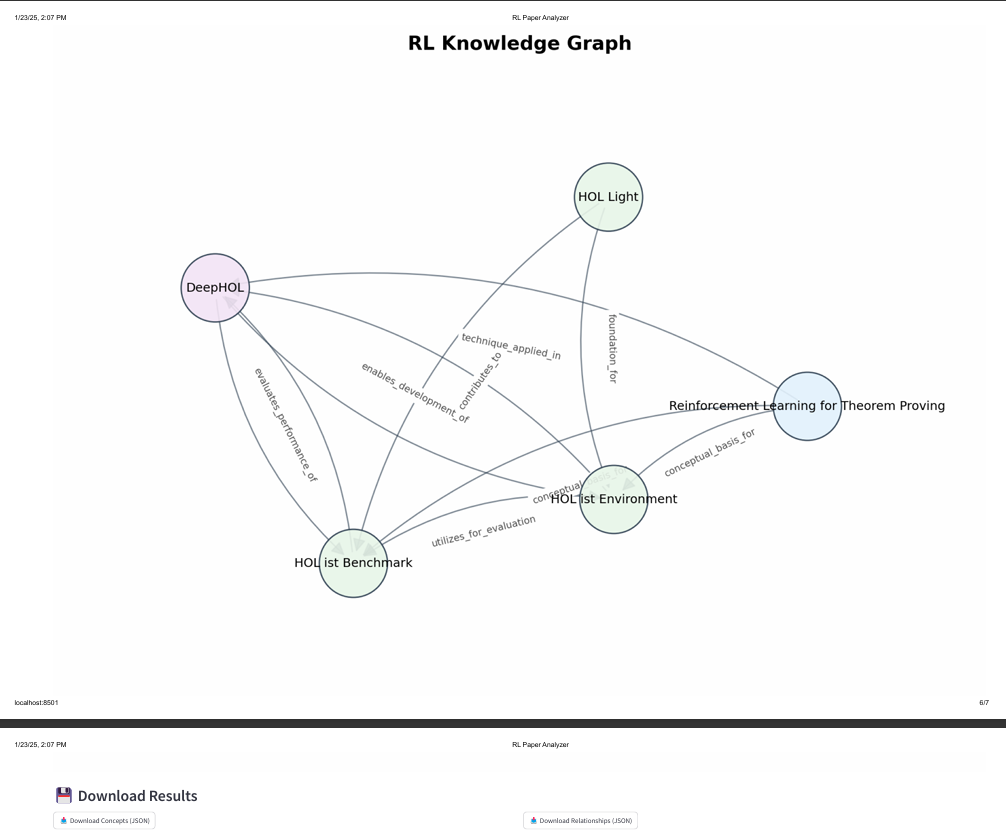
RL Paper to knowledge graph visualization
the graph can be downloaded, as png and as json (entities.json & relationships.json)
Comprehensive Analysis Interface (main.py)
streamlit run main.py
This interface provides:
Detailed, comprehensive synthesis
Step-by-step pipeline visualization
Full OCR and vision analysis results
In-depth figure and table analysis
Complete processing results and artifacts
Knowledge Graph

Initial upload screen of the main interface
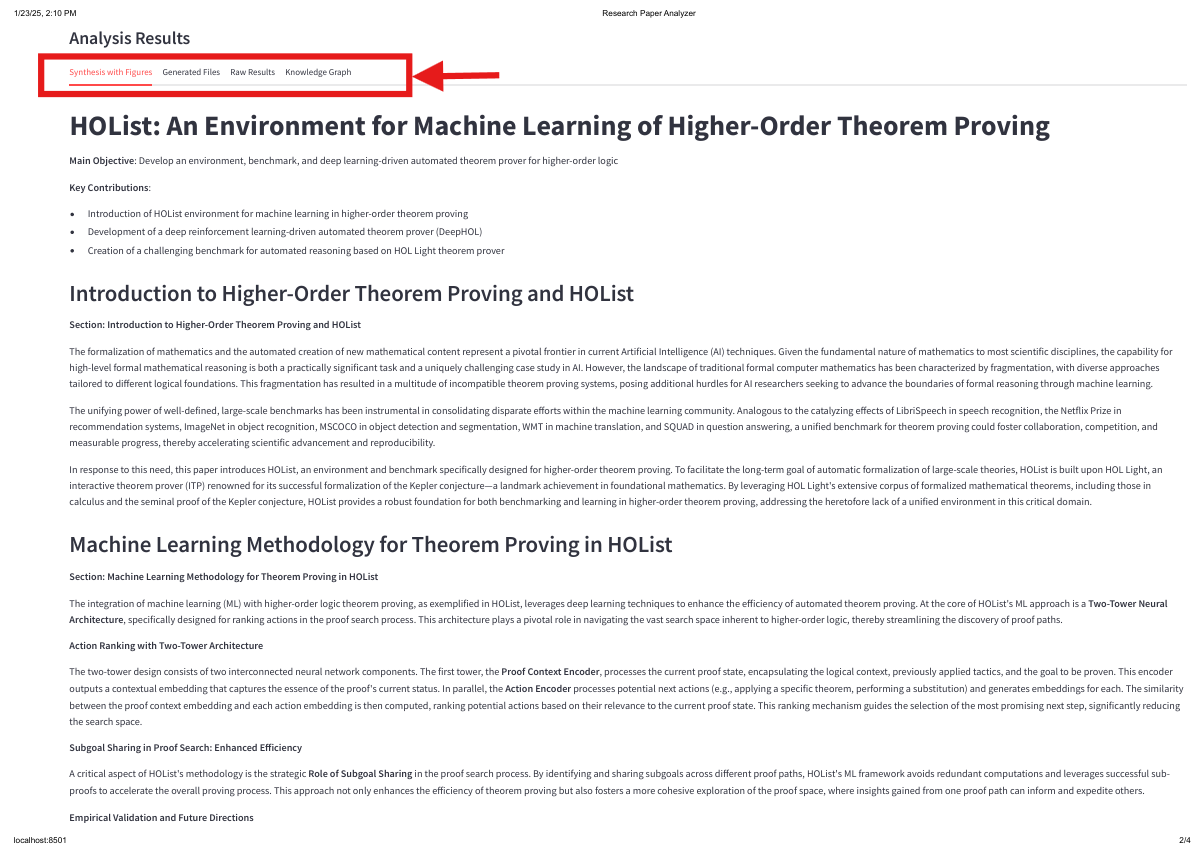
Different tabs available in the interface

Raw results view
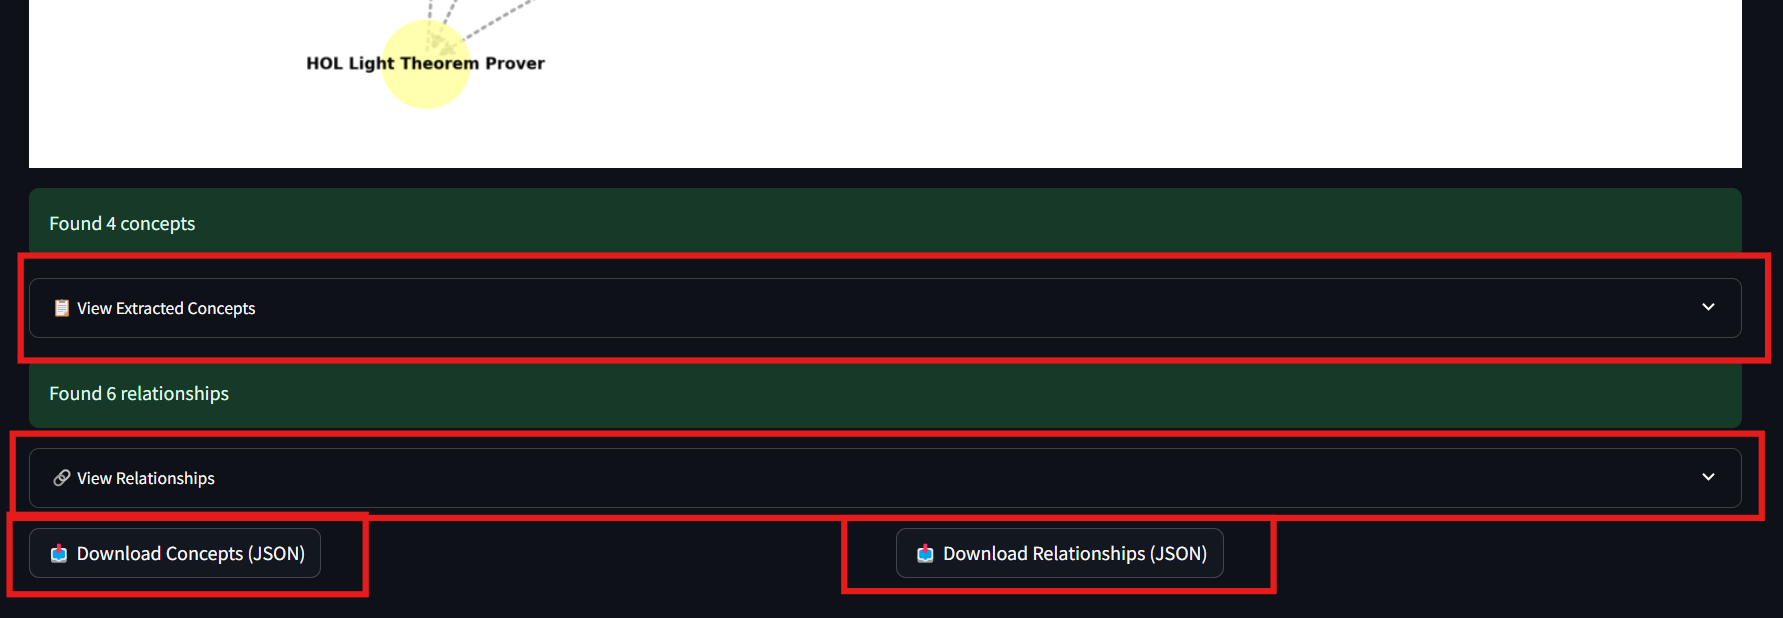
knowledge graph visualization and download
Customization
The pipeline can be customized through:
Model selection in vision analysis
Synthesis templates
Knowledge graph parameters
Output format modifications